Varna · Part 2
How India Speaks
TL;DR — While auditing the training corpus of varna, our 93M multilingual phone recognizer, we ended up with per-language phonetic statistics over 1,222 hours of speech across 11 Indic languages + Indian English: 611,054 utterances, ~44 million phone tokens, one shared IPA vocabulary. The numbers draw a surprisingly crisp picture of how differently these languages move — and of how the G2P labels themselves carry per-language "accents" that any shared phone model has to silently learn. Full numbers and scripts are in the repo; headline findings below.
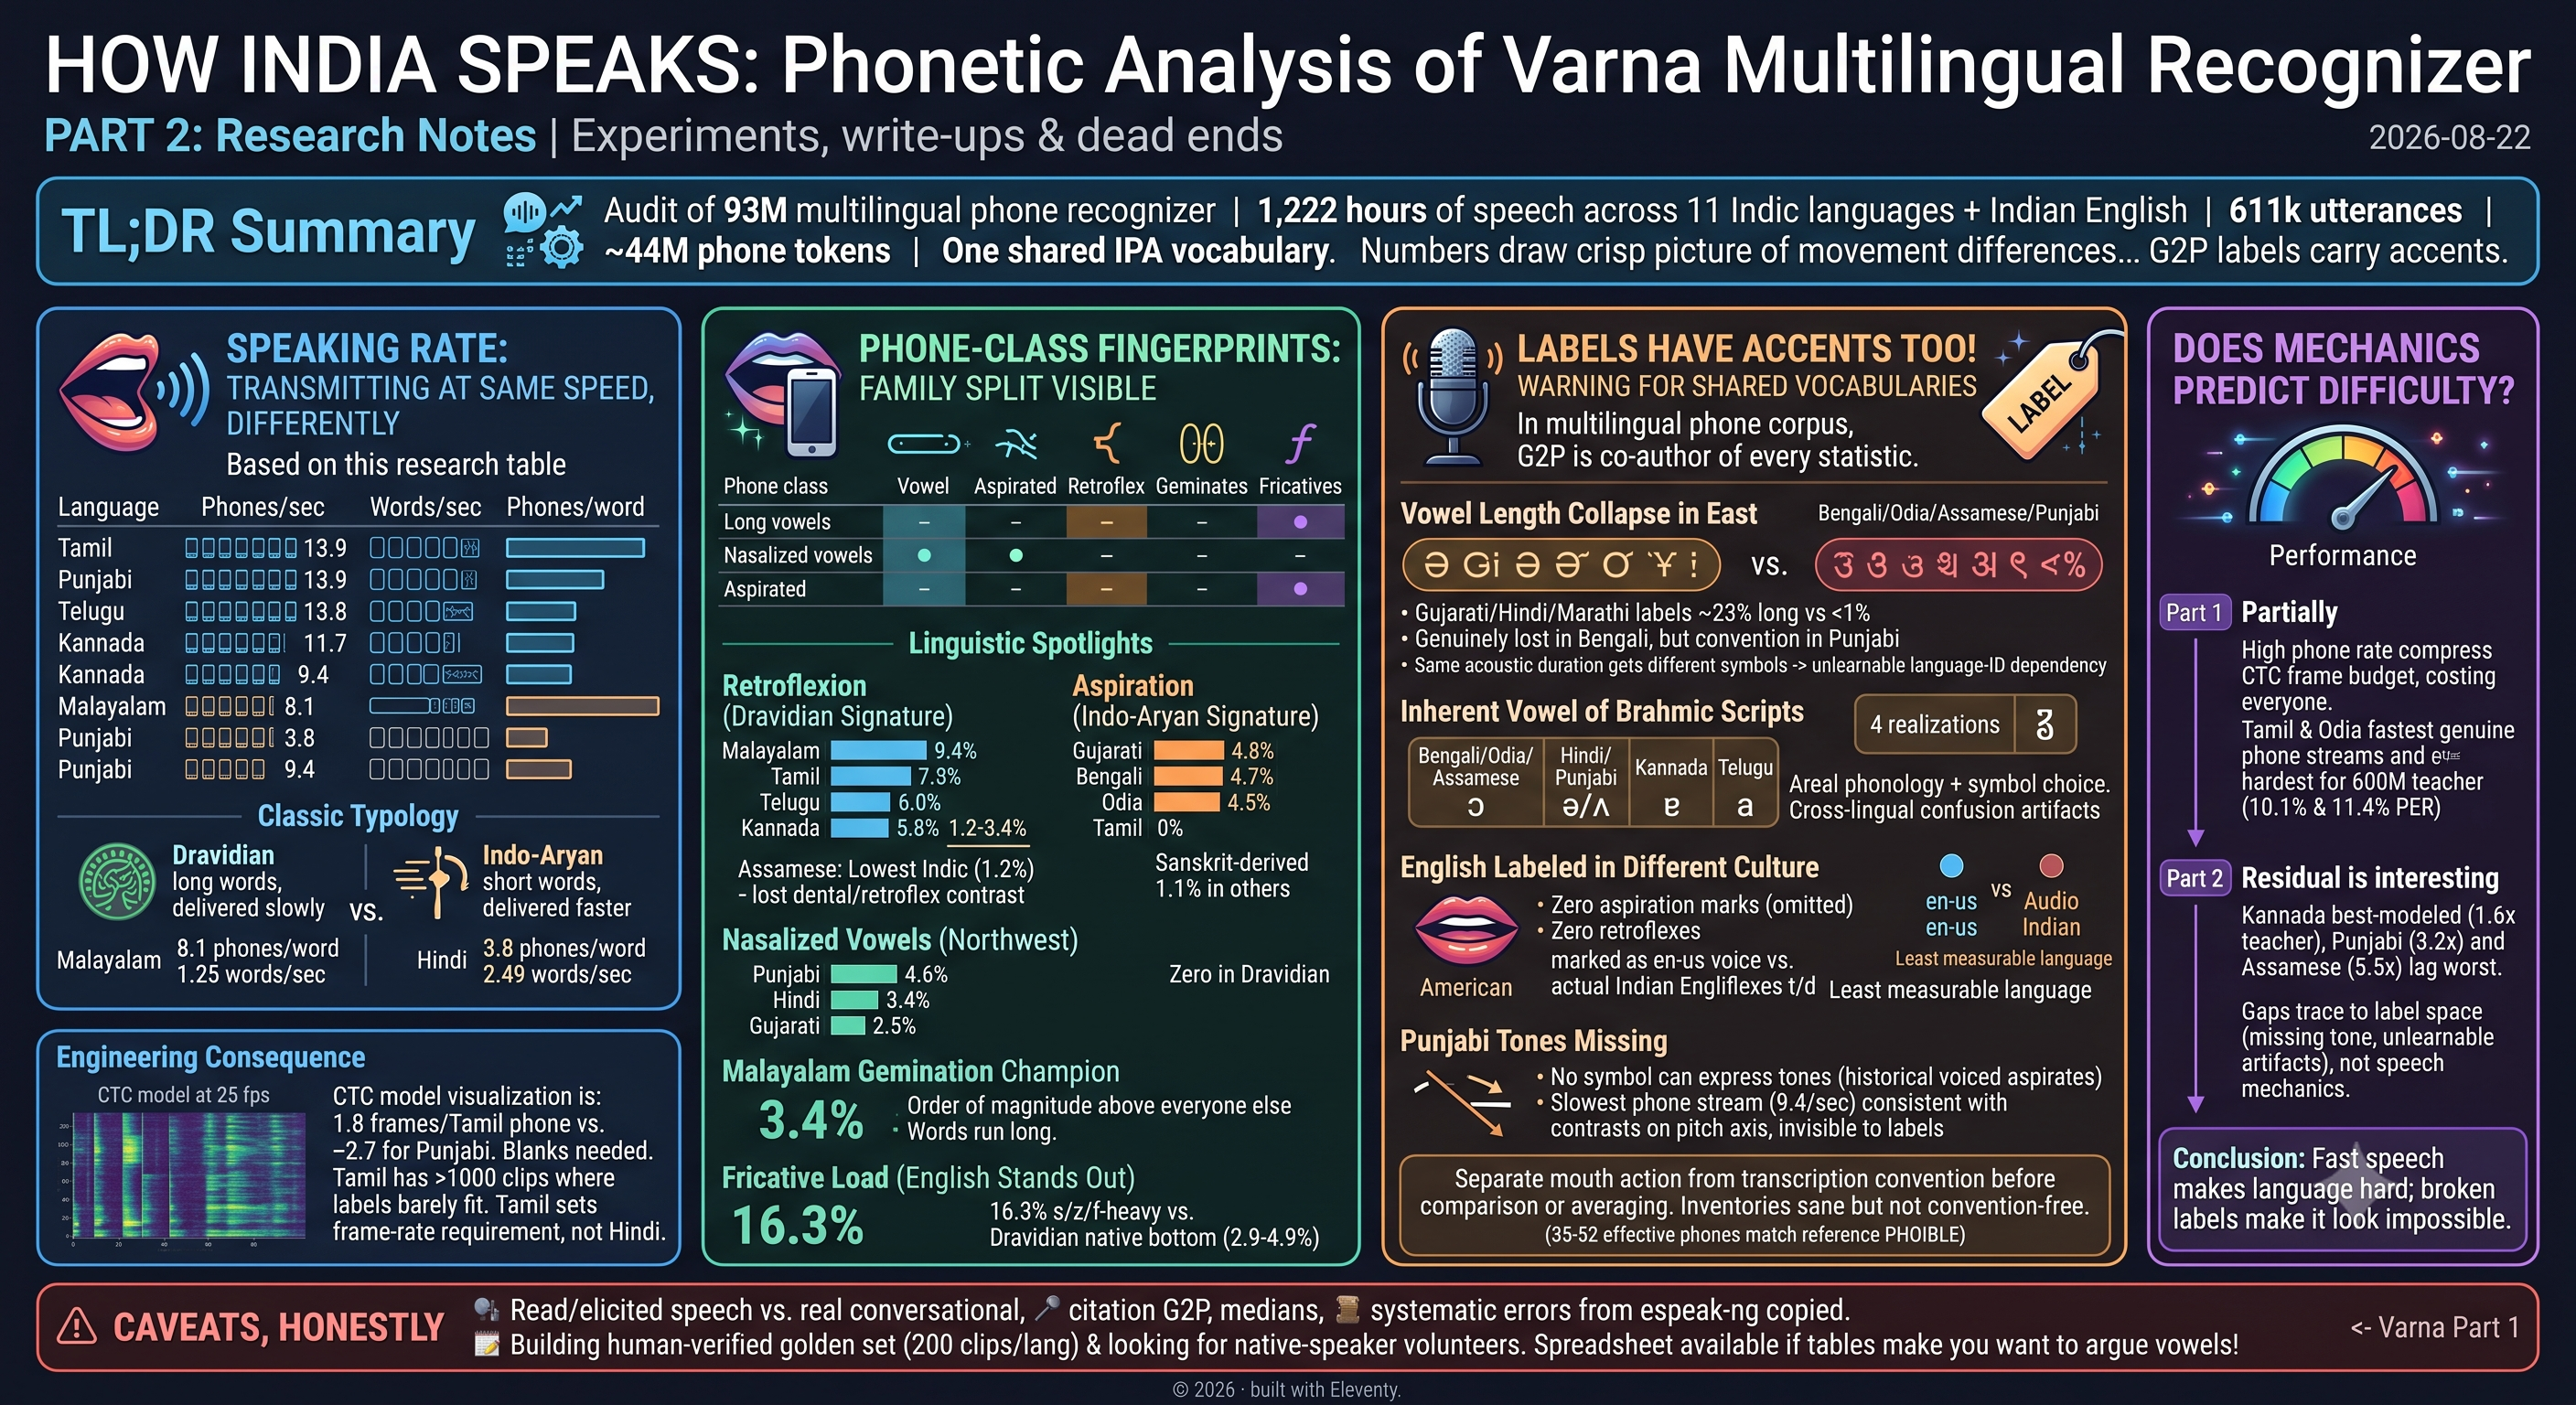
Speaking rate: everyone transmits at roughly the same speed — differently
Median rates over all training clips (phones exclude word boundaries and sentence marks; clips under 0.5 s dropped):
| Language | Phones/sec | Words/sec | Phones/word |
|---|---|---|---|
| Tamil | 13.9 | 1.88 | 7.3 |
| Assamese* | 13.1 | 2.60 | 5.1 |
| Odia | 11.5 | 1.93 | 5.8 |
| Kannada | 11.5 | 1.67 | 6.7 |
| Telugu | 11.2 | 1.70 | 6.6 |
| Malayalam | 10.3 | 1.25 | 8.1 |
| Marathi | 10.1 | 1.79 | 5.6 |
| Bengali | 10.1 | 1.88 | 5.2 |
| English (Indian) | 10.0 | 2.53 | 3.9 |
| Gujarati | 9.8 | 2.05 | 4.6 |
| Hindi | 9.6 | 2.49 | 3.8 |
| Punjabi | 9.4 | 2.31 | 4.0 |
*Assamese's phone rate is inflated by a known G2P artifact (character names rendered as phones) — treat Tamil as the true ceiling.
The classic typology falls straight out of the data. Dravidian languages build long words and deliver them slowly: Malayalam packs 8.1 phones into a word but speaks only 1.25 words a second — the agglutination champion. Hindi and Punjabi do the opposite: ~4-phone words at ~2.4 words a second. Yet the phone streams land in a narrow band (9.4–13.9 phones/sec): the information firehose is similar, the packaging is not.
This has a very concrete engineering consequence. A CTC model at 25 output frames per second has only 25 ÷ 13.9 ≈ 1.8 frames per Tamil phone at the median — and less in fast stretches — versus ~2.7 for Punjabi. CTC needs room to place blanks between repeated tokens; Tamil (with over a thousand training clips where the label barely fits the frame budget) is squeezed hardest, and it shows up as the hardest language for both our model and its 600M teacher. If you're designing a phone-level CTC stack for Indian languages, Tamil sets your frame-rate requirement, not Hindi.
Phone-class fingerprints: the family split is visible in every column
Share of phone tokens by class (percent of all non-structural tokens):
| Language | Long vowels | Nasalized vowels | Aspirated | Retroflex | Geminates | Fricatives |
|---|---|---|---|---|---|---|
| Gujarati | 23.1 | 2.5 | 4.8 | 3.4 | 0.4 | 5.8 |
| Hindi | 22.8 | 3.4 | 3.6 | 1.9 | 0.4 | 10.4 |
| Marathi | 22.5 | 1.4 | 3.5 | 5.3 | 1.4 | 8.7 |
| Telugu | 14.1 | 0 | 1.2 | 6.0 | 0 | 3.8 |
| Kannada | 9.8 | 0 | 1.1 | 5.8 | 0 | 4.9 |
| Malayalam | 8.6 | 0 | 1.1 | 9.4 | 3.4 | 2.9 |
| Tamil | 8.0 | 0 | 0 | 7.9 | 0.3 | 2.9 |
| Bengali | 1.0 | 0.2 | 4.7 | 2.1 | 0.2 | 8.8 |
| Assamese | 0.8 | 0.3 | 3.1 | 1.2 | 0 | 9.7 |
| Odia | 0.5 | 0.8 | 4.5 | 1.9 | 0.1 | 8.8 |
| Punjabi | 0.1 | 4.6 | 2.4 | 3.0 | 0.6 | 9.5 |
| English (Indian) | 7.1 | 0 | 0 | 0 | 0 | 16.3 |
What's real linguistics here:
- Retroflexion is the Dravidian signature: Malayalam 9.4%, Tamil 7.9%, Telugu 6.0%, Kannada 5.8% — versus 1.2–3.4% across Indo-Aryan. And the single lowest retroflex user among Indic languages is Assamese — which is exactly right: Assamese is famous for having lost the dental/retroflex contrast entirely (everything collapsed to alveolar). The corpus knows.
- Aspiration is the Indo-Aryan signature: Gujarati/Bengali/Odia at 4.5–4.8% versus Tamil at exactly zero — Tamil phonology has no aspirates, and the ~1.1% in Kannada/Malayalam/Telugu is mostly Sanskrit-derived vocabulary.
- Nasalized vowels live in the northwest: Punjabi 4.6%, Hindi 3.4%, Gujarati 2.5%; zero in all four Dravidian languages.
- Malayalam is the gemination language (3.4%, an order of magnitude above everyone else) — real, and one reason its words run long.
- Fricative load separates English from everything (16.3% — s/z/f-heavy), with Dravidian native vocabulary at the bottom (2.9–4.9%).
The labels have accents too — and that's a warning for shared vocabularies
Some column contrasts above are not linguistics — they're espeak's per-language transcription conventions, and they matter if you train one model over a shared symbol set:
- Vowel length collapses in the east: Gujarati/Hindi/Marathi labels are ~23% long vowels, while Bengali/Odia/Assamese/Punjabi sit under 1%. Bengali genuinely lost phonemic vowel length, but the near-total absence in Punjabi labels is convention as much as phonology. The same acoustic duration gets different symbols depending on the language — a shared-vocab model must learn whose convention applies, which is exactly the kind of hidden language-ID dependency a "universal" phone recognizer is supposed to avoid.
- The inherent vowel of the Brahmic scripts surfaces four different ways. Each language's most frequent phone is its inherent-vowel realization, and espeak renders it as ɔ in Bengali/Odia/Assamese (Odia: 15.9% of all tokens!), ə/ʌ in Hindi/Punjabi, ɐ in Kannada (16.7% — the single most frequent phone in the entire corpus), and plain a in Telugu (14.0%). Some of that is real areal phonology; some is symbol choice. Cross-lingual confusions between ə/ʌ/ɐ/a/ɔ are partly an artifact of the label space, and any cross-language PER comparison silently includes them.
- English is labeled in a different culture altogether: zero aspiration marks (allophonic in English, so espeak omits what it marks contrastively in Hindi), zero retroflexes (espeak's en-us voice — while actual Indian English famously retroflexes its t/d). The labels describe General American; the audio is Indian. We've written before about why English is our least-measurable language; this is the mechanism.
- Punjabi's tones don't exist in the labels at all. Punjabi is genuinely tonal — the historical voiced aspirates became tones — and no symbol in the inventory can express that. Punjabi also has the slowest phone stream (9.4/sec), consistent with contrasts having moved off the phone axis onto pitch, where our labels can't see them.
The general lesson: in a multilingual phone corpus, the G2P is a co-author of every statistic. Before comparing languages — or averaging a benchmark across them — separate what the mouth does from what the transcription convention does. Our frequency-weighted inventories match the PHOIBLE reference inventories almost exactly (35–52 effective phones per language), so the labels are sane — but sane and convention-free are different things.
Does mechanics predict difficulty?
Partially — and the residual is the interesting part. Tamil and Odia (the two fastest genuine phone streams after the Assamese artifact) are also the two hardest languages for the 600M teacher (10.1% and 11.4% PER on our golden set). Phone rate compresses the CTC frame budget, and it costs everyone. But our model's distance from the teacher tells a different story: Kannada is best-modeled (1.6× teacher PER), while Punjabi (3.2×) and Assamese (5.5×) lag worst — and both of those gaps trace to the label space (missing tone; unlearnable artifact tokens), not to speech mechanics. Fast speech makes a language hard; broken labels make it look impossible.
Caveats, honestly
All numbers are measured over read/elicited speech (FLEURS, Kathbath, IndicVoices, LibriSpeech, Svarah) with citation-form G2P labels — real conversational speech runs faster and reduces more. Rates are medians over utterances, not syllable-timed lab measurements. And every number passed through espeak-ng: where espeak is wrong systematically, so are we — which is precisely why we're building a human-verified golden set (200 clips per language) and looking for native-speaker volunteers. If the tables above made you want to argue about your language's vowels: excellent, we have a spreadsheet for you.